PEM Client Preferences v9
Use options on the Preferences dialog to customize the behavior of the PEM web interface. To open the dialog, select Preferences from the File menu. The left pane of the Preferences dialog displays a tree control; each node of the tree control provides access to options that are related to the node under which they are displayed.
- Use the plus sign (+) to the left of a node name to expand a segment of the tree control.
- Use the minus sign (-) to the left of a node name to close that node.
The BART Servers Node
Use the Nodes panel to select the BART Servers that will be displayed in the Browser tree control of BART Servers:
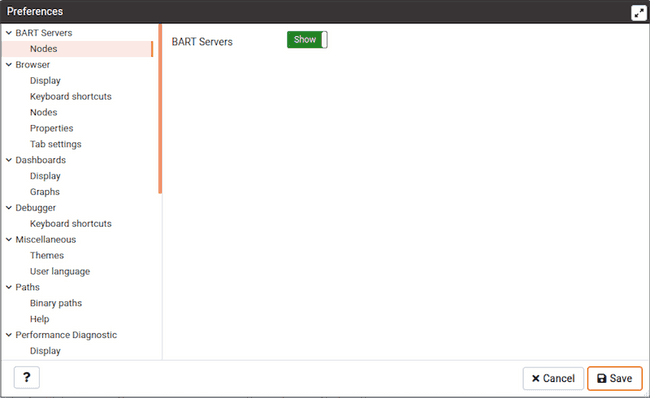
- Slide the switch located next to BART Servers to show or hide the BART Servers in the browser tree.
The Browser Node
Use the fields on the Browser node of the tree control to personalize your workspace.
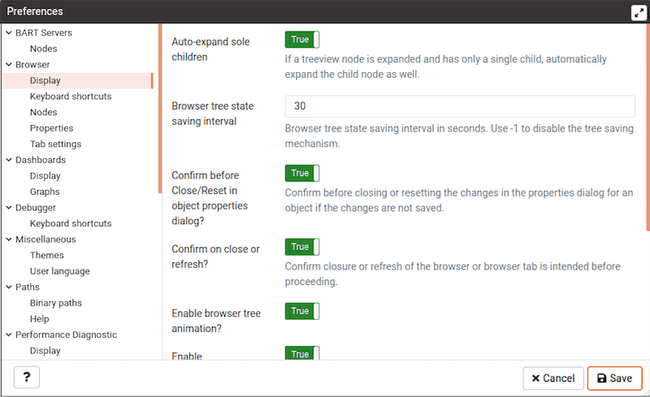
Use the fields on the Display panel to specify general display preferences:
- When the
Enable browser tree animation?switch is set toTrue, the client will display the animated tree control; if the switch isFalse, the tree control will be unanimated. - When the
Auto-expand sole childrenswitch is set toTrue, child nodes will be automatically expanded if a treeview node is expanded and has only a single child. - Use the
Browser tree state saving intervalfield to set the treeview state saving interval. A value of-1will disable the treeview state saving functionality. - When the
Confirm before closing properties with unsaved changesswitch is set toTrue, PEM will warn you before closing the properties dialog of an object if there are any unsaved changes. On user confirmation, the properties dialog will close. - When the
Confirm on close or refreshswitch is set toTrue, PEM will attempt to catch browser close or refresh events and prompt before allowing them to continue. - When the
Show system objects?switch is set toTrue, the client will display system objects such as system schemas (for example,pg_temp) or system columns (for example,xminorctid) in the tree control. - When the
Enable dialogue/notification animation?switch is set toTrue, the client will display the animated dialogues/notifications; if the switch isFalse, the tree control will be unanimated. - Set
Show hidden groups?toTrueto display hidden groups in the Browser tree control. - Set
Show system objects?toTrueto display system objects such as system schemas (for example,pg_temp) or system columns (for example,xminorctid) in the Browser tree control. - Use the
Lock layoutfield to lock the UI layout at different levels.
| Option | Action |
|---|---|
None | No locking. Every panel is resizable and dockable. |
Prevent docking | This will disable the docking/undocking of the panels |
Full | This will disable resizing, docking/undocking of the panels |
- When the
Show system objects?switch is set toTrue, the client will display system objects such as system schemas (for example,pg_temp) or system columns (for example,xminorctid) in the tree control.
Use the fields on the Keyboard shortcuts panel to configure shortcuts for the main window navigation:
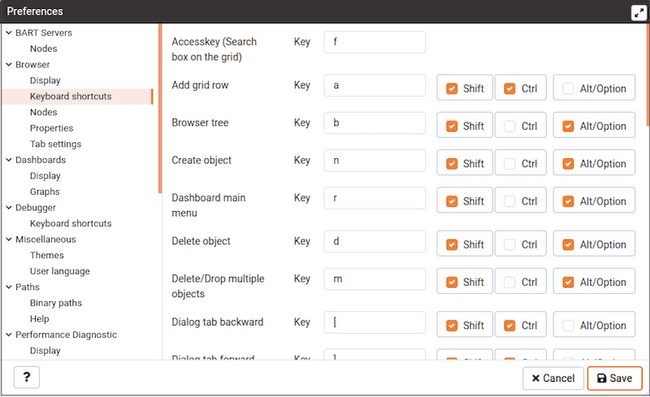
- Use controls on the
Keyboard shortcutspanel to specify the combination of modifier keys that define shortcuts for the PEM main window.
Use the fields on the Nodes panel to select the object types that will be displayed in the Browser tree control:
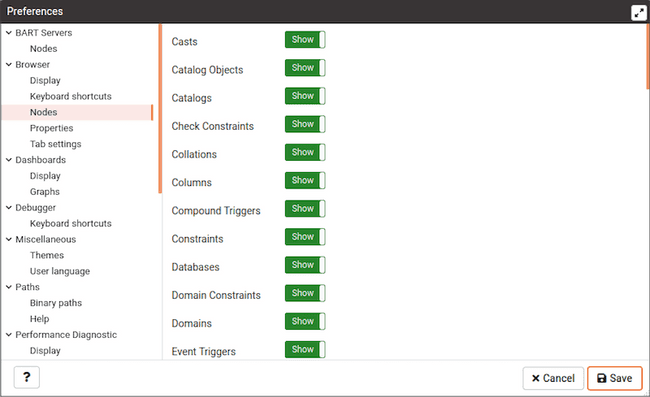
- The panel displays a list of database objects; slide the switch located next to each object type to
ShoworHidethe database object. When querying system catalogs, you can reduce the number of object types displayed to increase speed.
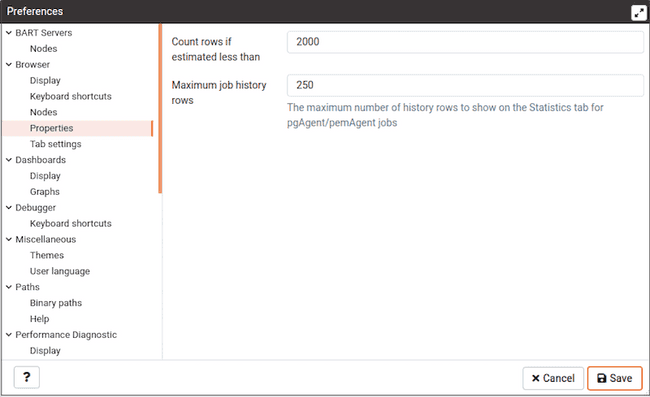
Use fields on the Properties panel to specify browser properties:
- Include a value in the
Count rows if estimated less thanfield to perform aSELECT count()if the estimated number of rows in a table (as read from the table statistics) is below the specified limit. After performing theSELECT count(), PEM will display the row count. The default is 2000. - Provide a value in the
Maximum job history rowsfield to limit the number of rows to show on the statistics tab for pgAgent jobs. The default is 250.
Use field on Tab settings panel to specify the tab related properties.
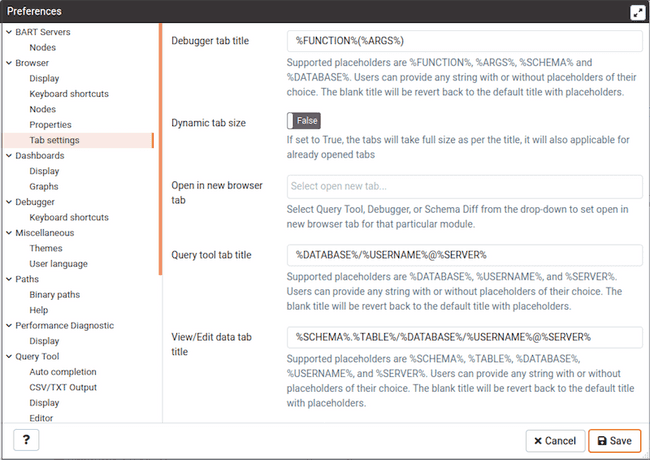
- Use Debugger tab title placeholder field to customize the Debugger tab title.
- When the Dynamic tab size If set to True, the tabs will take full size as per the title, it will also applicable for already opened tabs
- When the Open in new browser tab filed is selected for Query tool, Schema Diff or Debugger, it will open in a new browser tab when invoked.
- Use the Query tool tab title placeholder field to customize the query tool tab title.
- Use View/Edit tab title placeholder field to customize the View/Edit Data tab title.
The Dashboards Node
Expand the Dashboards node to specify your dashboard display preferences.
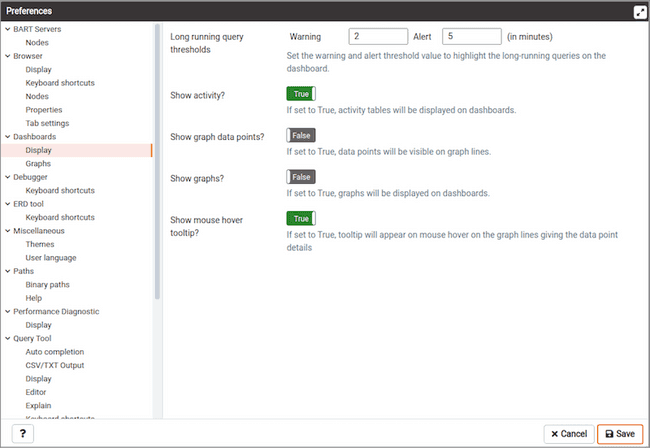
- Set the warning and alert threshold value to highlight the long-running queries on the dashboard.
- When the
Show activity?switch is set toTrue, activity tables will be displayed on dashboards. - When the
Show graph data points?switch is set toTrue, data points will be visible on graph lines. - When the
Show graphs?switch is set toTrue, graphs will be displayed on dashboards. - When the
Show mouse hover tooltip?switch is set toTrue, a tooltip will appear on mouse hover on the graph lines giving the data point details.
Use the fields on the Graphs panel to specify your display preferences for the graphs on the Dashboard tab:
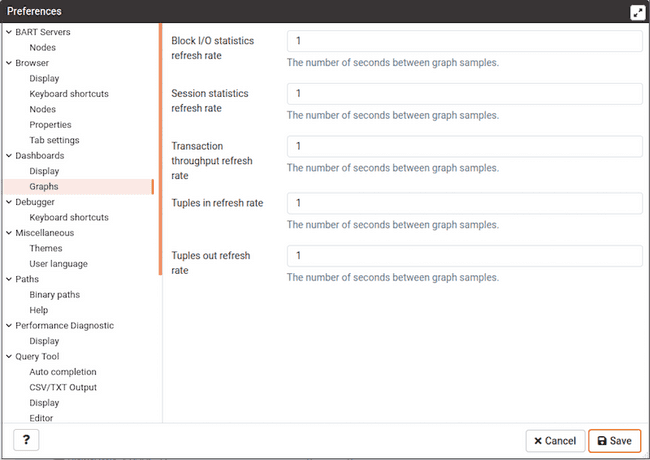
Use the fields on the Graphs panel to specify your display preferences for the graphs on the Dashboard tab:
- Use the
Block I/O statistics refresh ratefield to specify the number of seconds between block I/O statistic samples displayed in graphs. - Use the
Session statistics refresh ratefield to specify the number of seconds between session statistic samples displayed in graphs. - Use the
Transaction throughput refresh ratefield to specify the number of seconds between transaction throughput samples displayed in graphs. - Use the
Tuples in refresh ratefield to specify the number of seconds between tuples-in samples displayed in graphs. - Use the
Tuples out refresh ratefield to specify the number of seconds between tuples-out samples displayed in graphs.
The Debugger Node
Expand the Debugger node to specify your debugger display preferences.
Use the fields on the Keyboard shortcuts panel to configure shortcuts for the debugger window navigation:
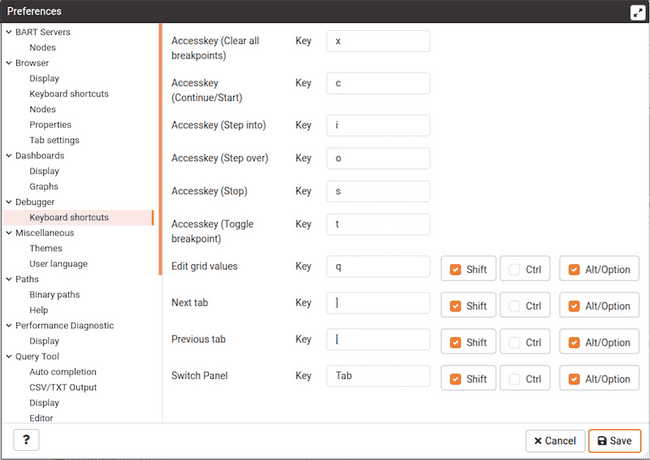
The Miscellaneous Node
Expand the Miscellaneous node to specify miscellaneous display preferences.
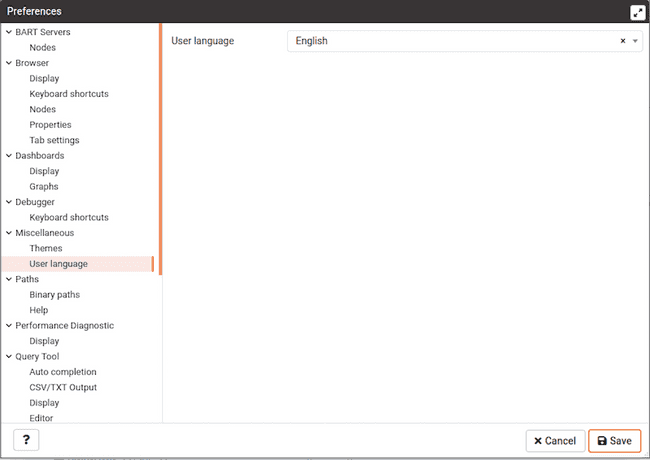
- Use the
User languagedrop-down listbox to select the display language for the PEM web interface.
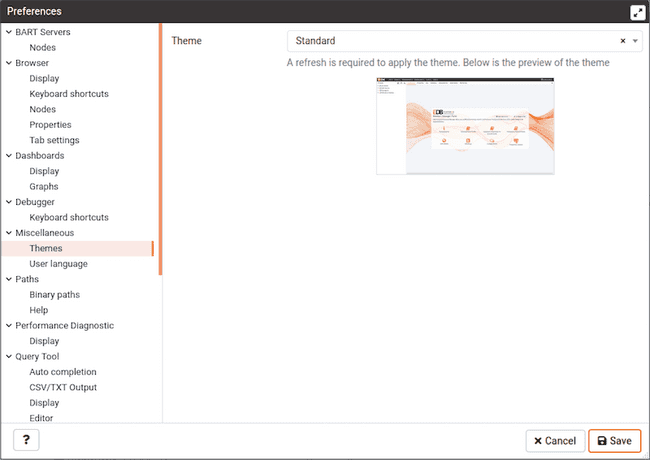
- Use the
Themesdrop-down listbox to select the theme for PEM. You'll also get a preview just below the drop down. Note that, to apply the theme you need to refresh the PEM page.
The Paths Node
Expand the Paths node to specify the locations of supporting utility and help files.
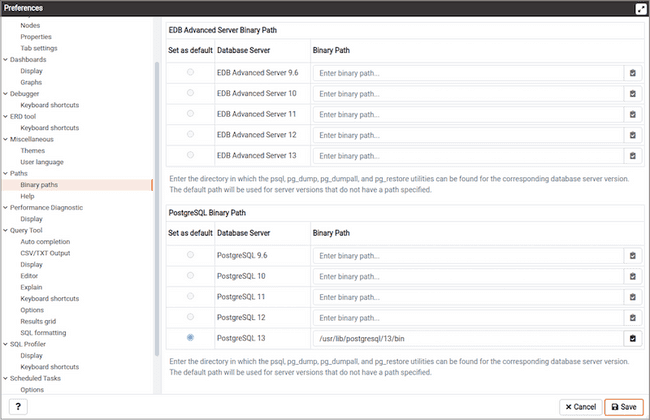
Use the fields on the Binary paths panel to specify the path to the directory that contains the utility programs (pg_dump, pg_restore, and pg_dumpall) for monitored databases:
- Use the
EDB Advanced Server Binary Pathfield to specify the location of the EDB Postgres Advanced Server utility programs. If this path is not set, PEM will attempt to find the utilities in standard locations used by EnterpriseDB. - Use the
Greenplum Database Binary Pathfield to specify the location of the Greenplum database utility programs. If this path is not set, PEM will attempt to find the utilities in standard locations used by Greenplum. - Use the
PostgreSQL Binary Pathfield to specify the location of the PostgreSQL utility programs. If this path is not set, PEM will attempt to find the utilities in standard locations used by PostgreSQL.
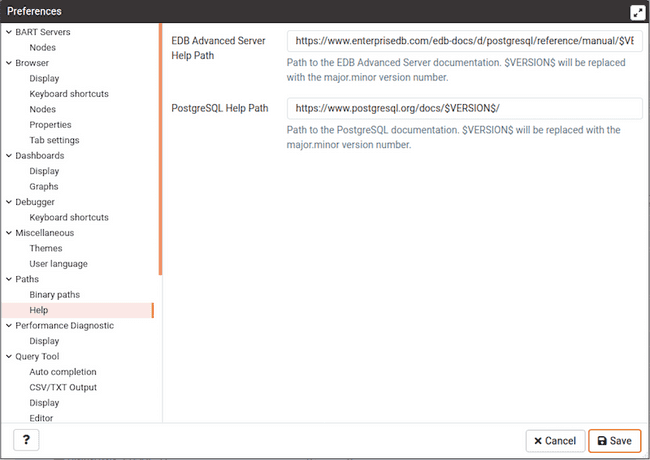
Use the fields on the Help panel to specify the location of help files.
- Use the
EDB Advanced Server Help Pathfield to specify the path to EDB Postgres Advanced Server documentation. - Use the
PostgreSQL Help Pathfield to specify the path to PostgreSQL documentation.
Please note: the default help paths include the VERSION placeholder; the $VERSION$ placeholder will be replaced by the current database version.
The Performance Diagnostic Node
Expand the Performance Diagnostic node to specify your preferences for the Performance Diagnostic tool.
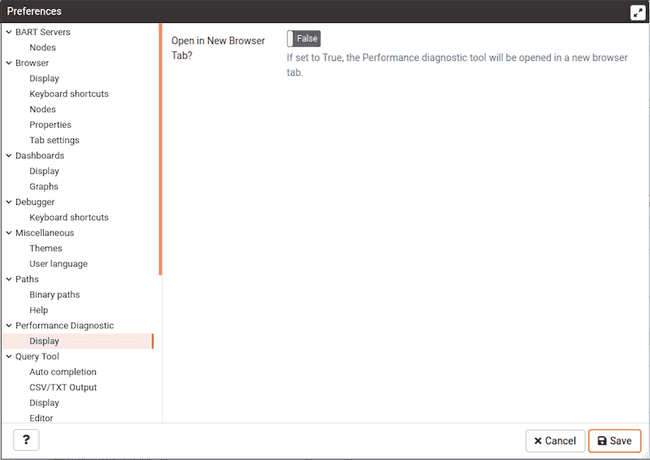
Use the fields on the Performance Diagnostic panel to control the Performance Diagnostic output.
- Use the
Default graph selectionfield to specify the default selection range in hours for performance diagnostic graphs. - When the
Open in new browser tab?switch is set to True, the Performance Diagnostic tool will be opened in a new browser tab.
The Query tool Node
Expand the Query tool node to access panels that allow you to specify your preferences for the Query Editor tool.
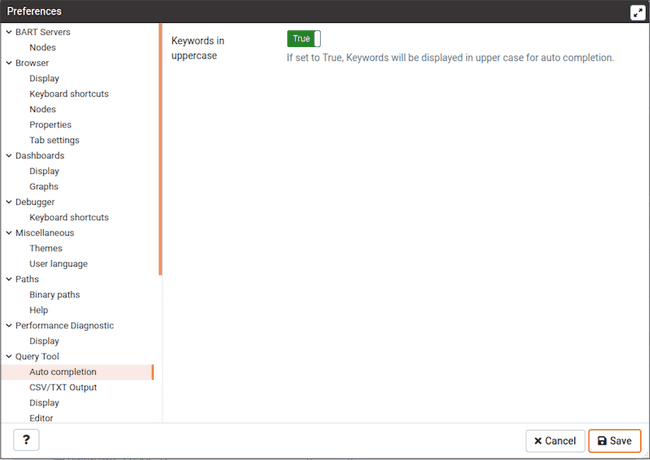
Use the fields on the Auto Completion panel to set the auto completion options.
- When the
Keywords in uppercaseswitch is set toTrue, keywords are displayed in upper case.
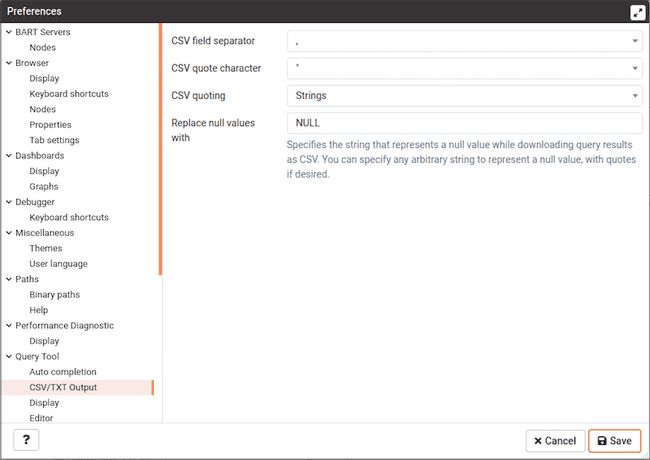
Use the fields on the CSV Output panel to control the CSV output.
- Use the
CSV field separatordrop-down listbox to specify the separator character that will be used in CSV/TXT output. - Use the
CSV quote characterdrop-down listbox to specify the quote character that will be used in CSV/TXT output. - Use the
CSV quotingdrop-down listbox to select the fields that will be quoted in the CSV/TXT output; selectStrings, All, orNone. - Use the
Replace null values withoption to replace null values with specified string in the output file. Default is set to 'NULL'.
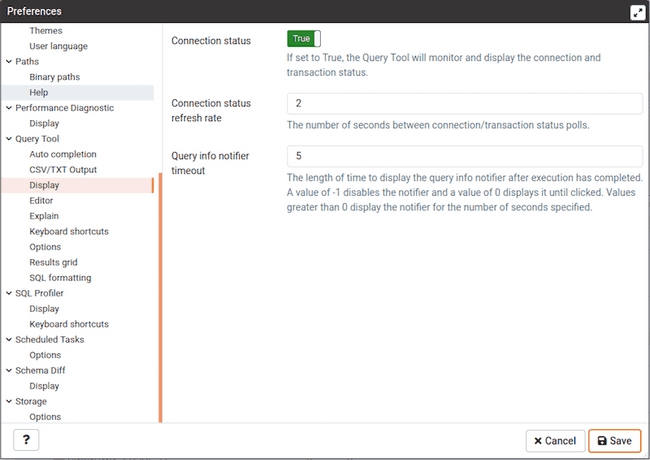
Use the fields on the Display panel to specify your preferences for the Query tool display.
- When the
Connection statusswitch is set toTrue, each new instance of the Query tool will display connection and transaction status. - Use the
Connection status refresh ratefield to specify the number of seconds between connection/transaction status updates. - Use the
Query info notifier timeoutfield to control the behaviour of the notifier that is displayed when query execution completes. A value of-1will disable the notifier, and a value of 0 will display it until clicked. If a positive value above zero is specified, the notifier will be displayed for the specified number of seconds. The default is5.
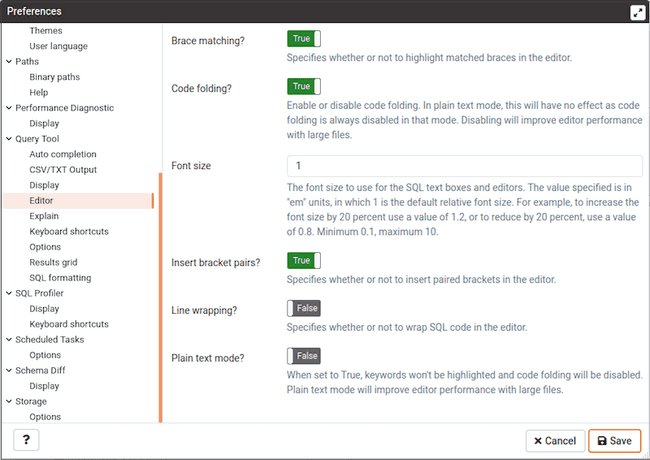
Use the fields on the Editor panel to change settings of the query editor.
- When the
Brace matching?switch is set toTrue, the editor will highlight pairs of matched braces. - When the
Code folding?switch is set toFalse, the editor will disable code folding. Disabling will improve editor performance with large files. - Use the
Font sizefield to specify the font size that will be used in text boxes and editors. - When the
Insert bracket pairs?switch is set toTrue, the editor will automatically insert paired brackets. - When the
Line wrappingswitch is set toTrue, the editor will implement line-wrapping behavior. - When the
Plain text mode?switch is set toTrue, the editor mode will be changed to text/plain. Keyword highlighting and code folding will be disabled. This will improve editor performance with large files.
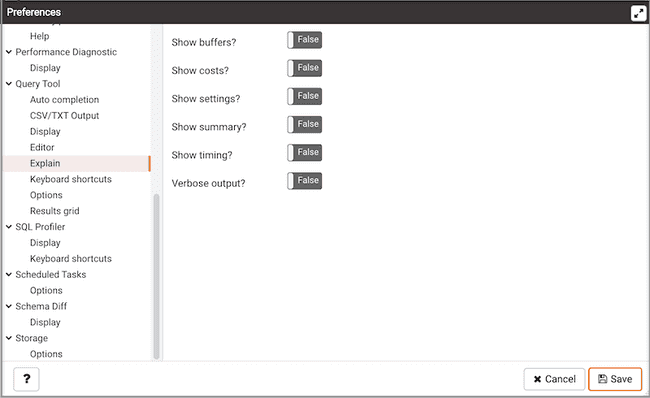
Use the fields on the Explain panel to specify the level of detail included in a graphical EXPLAIN.
- When the
Show Buffers?switch is set toTrue, graphical explain details will include information about buffer usage. - When the
Show Costs?switch is set toTrue, graphical explain details will include information about the estimated startup and total cost of each plan, as well as the estimated number of rows and the estimated width of each row. - When the
Show Timing?switch is set toTrue, graphical explain details will include the startup time and time spent in each node in the output. - When the
Verbose output?switch is set toTrue, graphical explain details will include extended information about the query execution plan.
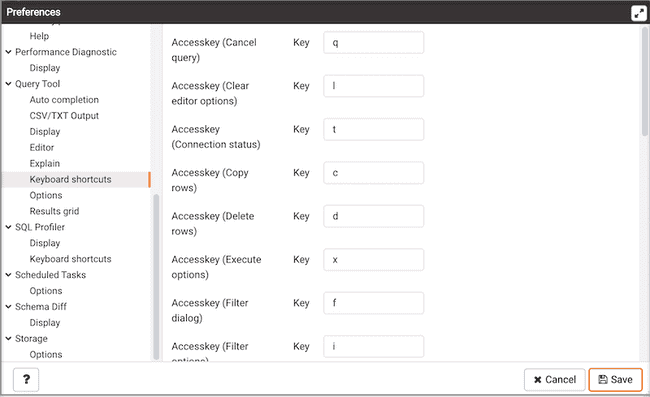
Use the fields on the Keyboard shortcuts panel to configure shortcuts for the Query tool.
Use the fields on the Options panel to manage Query tool preferences.
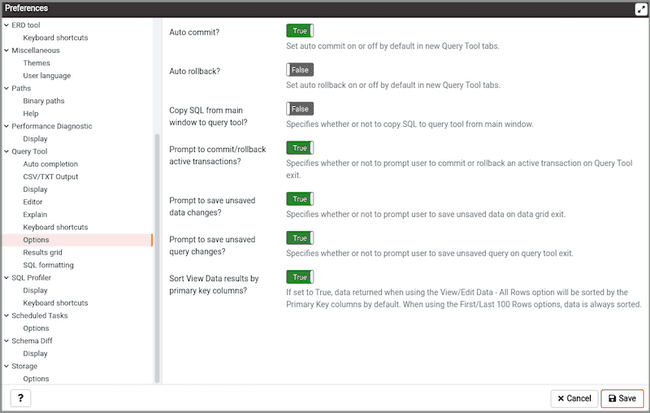
- When the
Auto-Commit?switch is set toTrue, each successful query is committed after execution. - When the
Auto-Rollback?switch is set toTrue, failed queries are rolled back. - When the Copy SQL from main window to query tool? switch is set to True, the CREATE sql of the selected object will be copied to query tool when query tool will open.
- When the
Prompt to save unsaved data changes?switch is set toTrue, the editor will prompt the user to saved unsaved data when exiting the data editor. - When the
Prompt to save unsaved query changes?switch is set toTrue, the editor will prompt the user to saved unsaved query modifications when exiting the query tool. - When the
Prompt to commit/rollback active transactions?switch is set toTrue, the editor will prompt the user to commit or rollback changes when exiting the Query tool while the current transaction is not committed. - When the
Sort View Data results by primary key columns?If set toTrue, data returned when using the View/Edit Data - All Rows option will be sorted by the Primary Key columns by default. When using the First/Last 100 Rows options, data is always sorted.
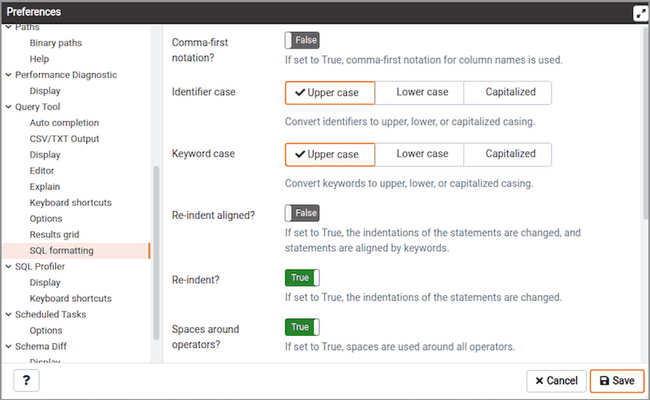
Use the fields on the SQL formatting panel to specify your preferences for reformatting of SQL.
- Use the Command-first notation option to specify whether to place commas before or after column names.
- Use the Identifier case option to specify whether to change identifiers (object names) into upper, lower, or capitalized case.
- Use the Keyword case option to specify whether to change keywords into upper, lower, or capitalized case.
- Use the Re-indent aligned? option to specify that indentations of statements should be changed, aligned by keywords.
- Use the Re-indent? option to specify that indentations of statements should be changed.
- Use the Spaces around operators? option to specify whether or not to include spaces on either side of operators.
- Use the Strip comments? option to specify whether or not comments should be removed.
- Use the Tab size option to specify the number of spaces per tab or indent.
- Use the Use spaces? option to select whether to use spaces or tabs when indenting.
- Use the Wrap after N characters option to specify the column limit for wrapping column separated lists (e.g. of column names in a table). If set to 0 (zero), each item will be on it's own line.
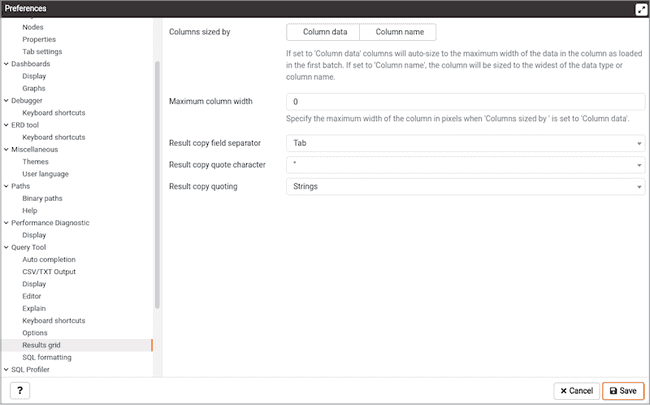
Use the fields on the Results grid panel to specify your formatting preferences for copied data.
- When the Columns sized by is set to Column data, then data columns will auto-size to the maximum width of the data in the column as loaded in the first batch. If set to Column name, the column will be sized to the widest of the data type or column name.
- Specify the maximum width of the column in pixels when 'Columns sized by' is set to Column data. If 'Columns sized by' is set to Column name then this setting won't have any effect.
- Use the
Result copy field separatordrop-down listbox to select the field separator for copied data. - Use the
Result copy quote characterdrop-down listbox to select the quote character for copied data. - Use the
Result copy quotingdrop-down listbox to select which type of fields require quoting; selectAll, None, orStrings.
The SQL Profiler Node
Use fields on the Display panel to specify SQL Profiler preferences.
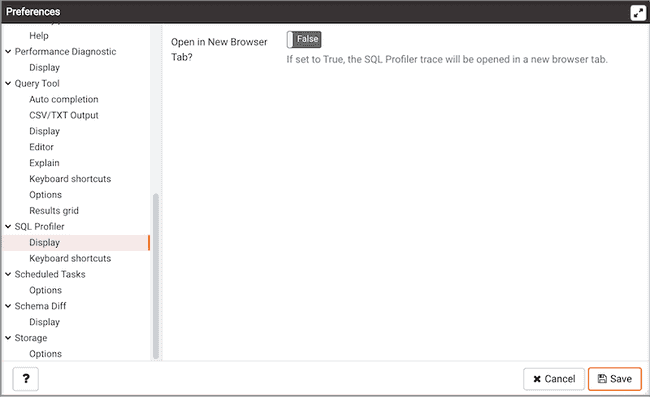
Set Open in New Browser Tab? to True to open SQL Profiler in a new browser tab when SQL Profiler is invoked.
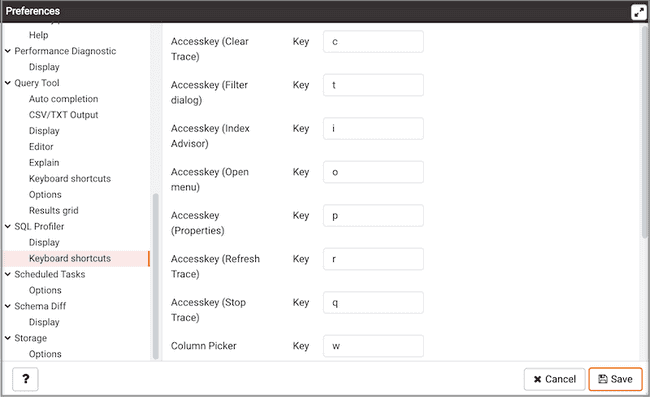
Use the fields on the Keyboard shortcuts panel to configure shortcuts for toolbar buttons on SQL profiler trace window.
The Scheduled Tasks Node
Use fields on the Options panel to specify Scheduled Tasks preferences.
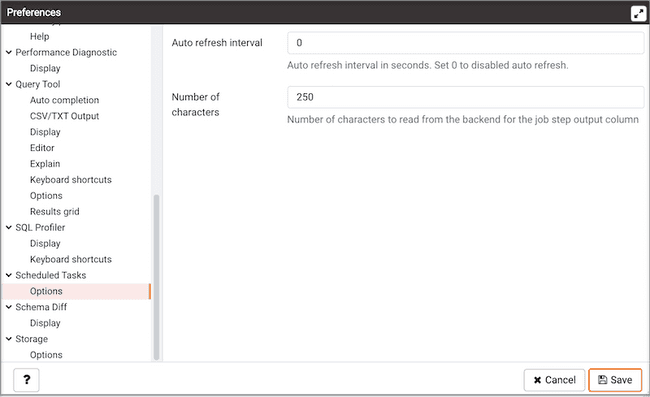
Use the Auto refresh interval field to specify the number of seconds between automatic refreshes; a value of 0 disables auto refresh.
The Schema Diff Node
Expand the Schema Diff node to specify your display preferences.
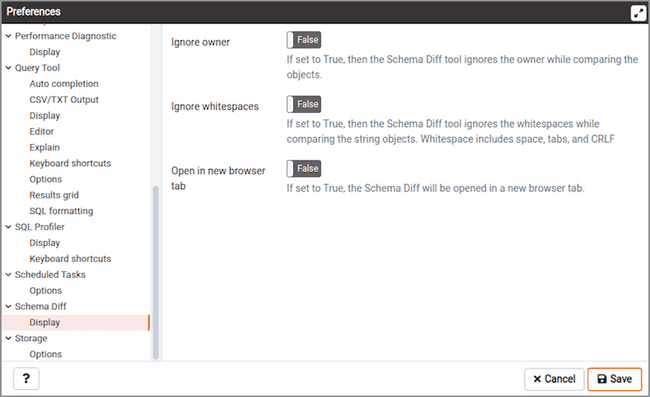
Use the Ignore owner switch to ignores the owner while comparing the objects.
Use the Ignore whitespaces switch to ignores the whitespaces while comparing the string objects. Whitespace includes space, tabs, and CRLF.
The Storage Node
Expand the Storage node to specify your storage preferences.
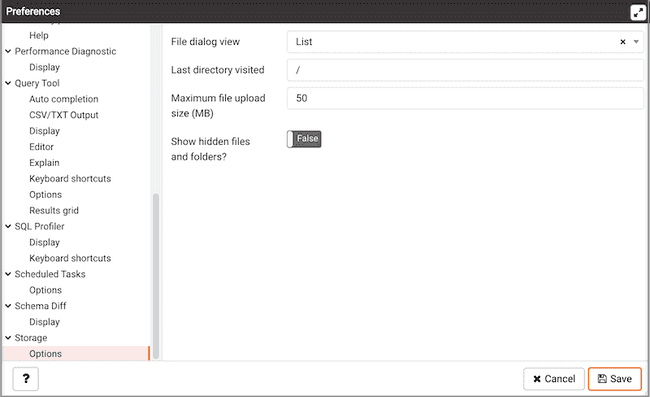
Use the fields on the Options panel to specify storage preferences.
- Use the
File dialog viewdrop-down listbox to select the style of icons and display format that will be displayed when you open the file manager; selectListto display a list view, orGridto display folder icons. - Use the
Last directory visitedfield to specify the name of the folder in which the file manager will open. - Use the
Maximum file upload size(MB)field on theOptionspanel of the Storage node to specify the maximum file size for an upload. - When the
Show hidden files and folders?switch is set toTrue, the file manager will display hidden files and folders.