PEM Architecture v9
Postgres Enterprise Manager (PEM) is a tool designed to monitor and manage multiple Postgres servers through a single GUI interface. PEM is capable of monitoring the following areas of the infrastructure:
Note: The term Postgres refers to either PostgreSQL or EDB Postgres Advanced Server.
- Hosts - One or more servers (physical or virtual) and their operating systems.
- Servers - One or more instances of PostgreSQL or EDB Postgres Advanced Server or EDB Postgres Extended (formerly known as 2ndQPostgres) running on a host.
- Databases - One or more databases and the schema objects (tables, indexes, etc.) within them.
PEM consists of a number of individual software components; the individual components are described below.
- PEM Server - The PEM Server is used as the data repository for monitoring data and as a server to which both Agents and Clients connect. The PEM server consists of an instance of PostgreSQL and an associated database for storage of monitoring data, and a server that provides web services.
- PEM Agent - The PEM Agent is responsible for executing tasks and reporting statistics from the Agent host and monitored Postgres instances to the PEM server. A single PEM Agent can monitor multiple installed instances of Postgres that reside on one or many hosts.
- PEM Web Client - The PEM web interface allows you to manage and monitor Postgres servers and utilize PEM extended functionality. The web interface software is installed with the PEM server and is accessed via any supported web browser.
- SQL Profiler - SQL Profiler is a Postgres server plugin to record the monitoring data and query plans to be analysed by the SQL Profiler tool in PEM. This is an optional component of PEM, but the plugin must be installed into each instance of Postgres with which you wish to use the SQL Profiler tool. The SQL Profiler may be used with any supported version of an EnterpriseDB distribution of a PostgreSQL server or Advanced Server (not just those managed through the PEM server). See the PEM SQL Profiler configuration docs for details and supported versions.
PEM architecture
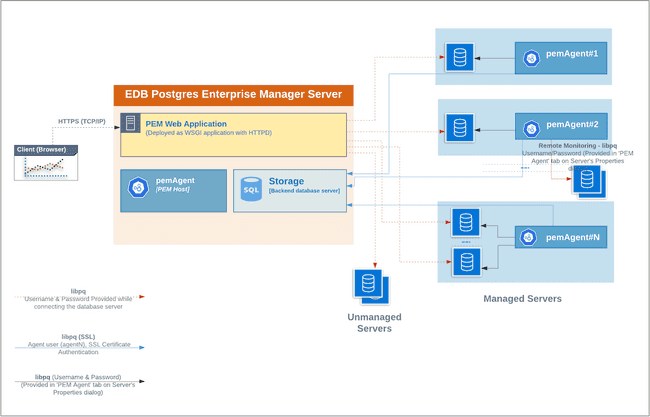
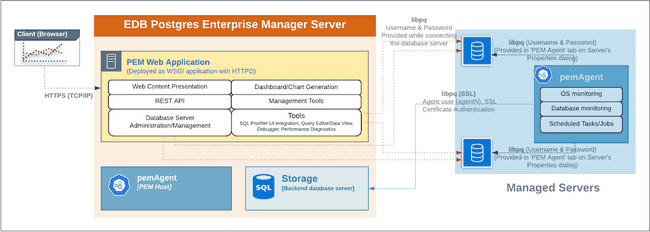
The following architectural diagram illustrates the relationships between the PEM server, clients, and managed as well as unmanaged Postgres servers.

The PEM Server

The PEM server consists of an instance of Postgres, an instance of the Apache web-server providing web services to the client, and a PEM Agent. PEM utilizes a server-side cryptographic plugin to generate authentication certificates.
The instance of Postgres (a database server) and an instance of the Apache web-server ( HTTPD) can be on the same host or on separate hosts.
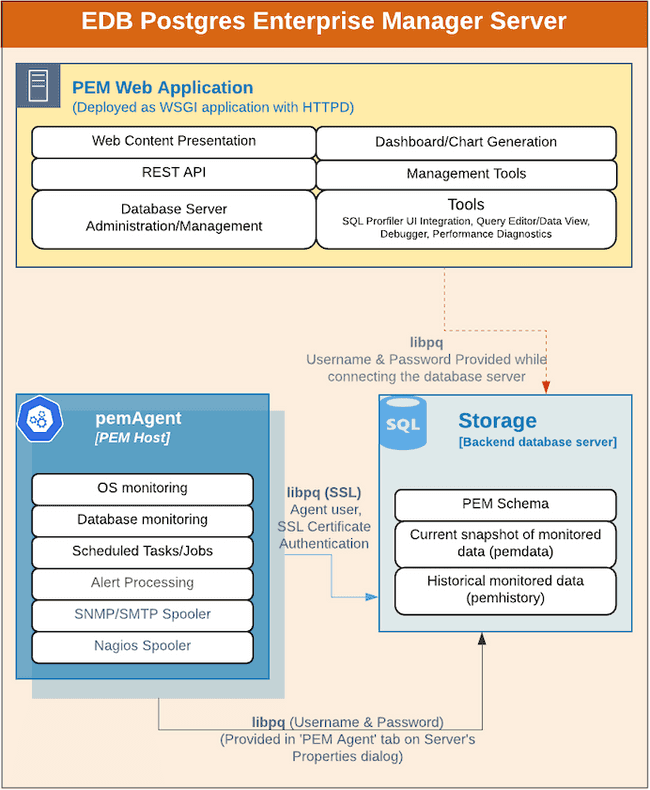
Postgres Instance (Database server) - This is the backend database server. It hosts a database named pem which acts as the repository for PEM Server. The pem database contains several schemas that store metric data collected from each monitored host, server, and database.
Note
All the PEM features are available irrespective of which backend database server you select, PostgreSQL or EDB Postgres Advanced Server.
- pem - This schema is the core of the PEM application. It contains the definitions of configuration functions, tables, or views required by the application.
- pemdata - This schema stores the current snapshot of the monitored data.
- pemhistory - This schema stores the historical monitored data.
Apache Web Server (HTTPD) - The PEM Web Application is deployed as a WSGI application with HTTPD to provide web services to the client. It is comprised of the following:
- Web content presentation - The presentation layer is created by the Web Application (for example Browser, login page,..).
- Rest API - The REST API allows integration with other apps and services.
- Database Server Administration/Management - Database server administration and management activities like CREATE, ALTER, DROP, etc. can be performed for managed as well as unmanaged servers.
- Dashboard/Chart generation - Internally, the web application includes functionality that generates Dashboards and Charts.
- Management Tools - The Audit Manager, Capacity Manager, Log Manager, Postgres Expert, Postgres Log Analysis Expert, and the Tuning Wizard are made available in the Web Application.
- Other tools provide functionality on managed or unmanaged servers:
- SQL Profiler UI Integration - SQL Profiler generates easily analyzed traces of session content.
- Query Editor/Data View - The Query editor allows you to query, edit, and view data.
- Debugger - The Debugger helps you debug queries.
- Performance Diagnostics - Performance Diagnostics help you analyze the performance of Advanced Server.
We recommended that you use a dedicated machine to host production instances of the PEM backend database. The host may be subject to high levels of data throughput, depending on the number of database servers that are being monitored and the workloads the servers are processing.
The PEM Agent

The PEM Agent is responsible for the collection of monitoring data from the machine and operating system, as well as from each of the Postgres instances to which they are bound. Each PEM Agent can monitor one physical or virtual machine and is capable of monitoring multiple database servers locally - installed on the same system, or remotely - installed on other systems. It is also responsible for executing other tasks that may be scheduled by the user (for example, server shutdowns, SQL Profiler traces, user-defined jobs).
A PEM Agent is installed by default on the PEM Server along with the installation of the PEM Server. It is generally referred to as a PEM Agent on the PEM Host. Separately, the PEM Agent can also be installed on the other servers hosting the Postgres instances to be monitored using PEM.
Whether monitoring locally or remotely, the PEM Agent connects to the PEM Server using PostgreSQL’s libpq, using SSL certificate-based authentication. The PEM Agent installer in Windows and pemworker CLI in Linux is responsible for registering each agent with the PEM Server, and generating and installing the required certificates.
Please note that there is only one-way traffic between the PEM Agent and PEM Server; the PEM Agent always connects to the PEM Server.
The PEM Agent must be able to connect to each database server that it monitors. This connection is made over a TCP/IP connection (or optionally a Unix Domain Socket on Unix hosts), and may optionally use SSL. The user must configure the connection and authentication to the monitored server.
Once configured, each agent collects statistics and other information on the host and each database server and database that it monitors. Each piece of information is known as a metric and is collected by a probe. Most probes will collect multiple metrics at once for efficiency. Examples of the metrics collected include:
- Disk I/O statistics
- Network statistics
- Database server version string
- Database server configuration option (GUC) values
- Table access statistics
- Table and index sizes
For a list of PEM probes, see Probes.
By default, the PEM Agent bound to the database server collects the OS/Database monitoring statistics and also runs any scheduled tasks/jobs for that particular database server, storing data in the pem database on the PEM server.
The Alert processing, SNMP/SMTP spoolers, and Nagios Spooler data is stored in the pem database on the PEM server and is then processed by the PEM Agent on the PEM Host by default. However, processing by other PEM Agents can be enabled by adjusting the SNMP/SMTP and Nagios parameters of the PEM Agents.
To see more information about these parameters see Server Configuration.
The PEM Web Client
The PEM client is a web-based application that runs in supported browsers. The client's web interface connects to the PEM server and allows direct management of managed or unmanaged servers, and the databases and schemas that reside on them.
The client allows you to use PEM functionality that makes use of the data logged on the server through features such as the dashboards, the Postgres Log Analysis Expert, and Capacity Manager.
The SQL Profiler Plugin
You are not required to install the SQL Profiler plugin on every server, but you must install and configure the plugin on each server on which you wish to use the SQL Profiler. You may also want to install and configure SQL Profiler on un-monitored development servers. For ad-hoc use also, you may temporarily install the SQL Profiler plugin.
The plugin is installed with the EDB Postgres Advanced Server distribution but must be installed separately for use with PostgreSQL. The SQL Profiler installer is available from the EnterpriseDB website.
SQL Profiler may be used on servers that are not managed through PEM, but to perform scheduled traces, a server must have the plugin installed, and must be managed by an installed and configured PEM agent.
For more information about using SQL Profiler, see the PEM SQL Profiler Configuration docs